Satisfaction among TSP participants declines in 2023 survey
Satisfaction among TSP participants declines in 2023 survey
By Drew Friedman
Participants in the Thrift Savings Plan felt less content with the TSP this year, according to the latest results of the Federal Retirement Thrift Investment Board’s annual satisfaction survey.
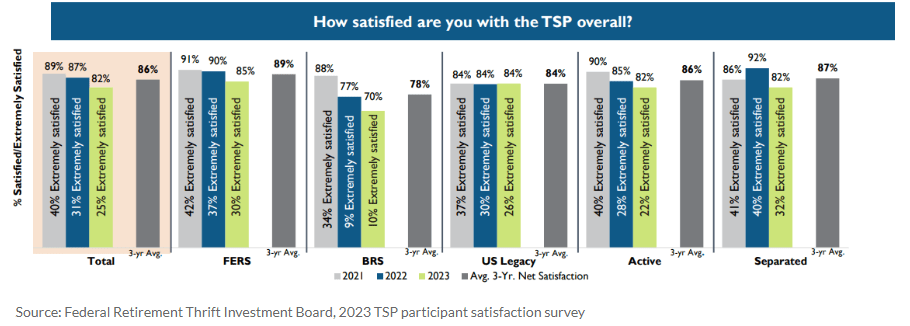
Currently, 82% of TSP participants are satisfied with the plan, compared with an 87% satisfaction rate in 2022, the board’s survey of tens of thousands of TSP participants showed.
The slumping satisfaction scores may not come as a surprise after the TSP’s tumultuous transition to a new recordkeeper in June 2022. The 2023 survey, conducted between March and May of this year, was the first time the major update was reflected in the annual participant satisfaction survey.

Kim Weaver, FRTIB’s director of external affairs, said the board is working to assess the latest round of feedback and make adjustments where necessary.
“We want our participants to be satisfied with our services, so we are taking [the results] to heart,” Weaver said in an interview with Federal News Network.
The participant satisfaction survey collects broad information from participants by considering various aspects that may affect participants’ perceptions of the TSP. As it has done for many years, FRTIB — the agency that manages the TSP — partnered with Gallup to survey a sample of participants on different aspects of the plan.
The Gallup survey was administered roughly 10 months after the June 2022 transition to the new recordkeeper and received an overall response rate of 12%. The board said it will use the results as a benchmark to measure satisfaction beyond the immediate period following the major 2022 update.
Along with declining satisfaction overall, participants’ satisfaction with the TSP’s customer service center, called ThriftLine, also fell steeply between 2022 and 2023. The percentage of TSP participants who said they were satisfied with ThriftLine representatives’ ability to answer their questions or address their needs dropped from 90% to 74%.
Overall, the survey showed that the top drivers of satisfaction are plan information on TSP’s website, account statements and the ability to rollover or transfer balances in and out of the plan.
Weaver said it’s also been a common finding over the years for the security of TSP.gov to be a major driver of participant satisfaction. It’s one of the key reasons that the board opted to switch to a new recordkeeper in the first place — to improve the security of the platform.
“We’ve got information about them, we’ve got information about their investments, and they want us to be secure,” Weaver said. “We absolutely want to make that happen.”
Despite the topline changes in satisfaction, some results of the survey have remained consistent for years. Overall, account security and annual statements continue to be the most highly rated aspects of the plan.
As the board has seen in several prior surveys, participants who contribute more to the plan are also typically more satisfied with the plan.
And not surprisingly, the market itself is also a major driver of satisfaction with the TSP.
“When the market is doing better, TSP participants are more satisfied. When the market is not doing as well, participants are less satisfied,” Weaver said. “But that’s of course not the sole driver of participant satisfaction.”
Another trend that has been consistent for years is satisfaction of participants in the blended retirement system (BRS) lagging behind satisfaction of the rest of TSP participants.
The BRS, a program reserved for military members, offers a “blend” of two major sources of retirement income: a traditional retirement pension and a TSP account.
While overall TSP satisfaction was at 82%, BRS participants reported 70% satisfaction with the TSP — 12 points below the average. The group was also the least satisfied with withdrawal options and had the lowest response rate of any group included in the survey.
Weaver said based on the survey results alone, it’s hard to draw conclusions on why BRS participants score so much lower than other TSP participants.
“We’re going to try and do focus groups with BRS members to drill down and find out what they’re really talking about,” Weaver said. “We have a suspicion that if you’re 19, 20 or 21 years old, and you’re contributing to the TSP, you might be equating it to a checking account or a savings account, as opposed to retirement savings. That could be a driver, or it could be something entirely different. That’s why we want to do the focus groups.”
Overall, Weaver said the board uses the survey to gather feedback from participants and eventually determine what changes may be needed for the plan.
One change FRTIB made in response to requests from participants, for instance, was adding instructions and tutorials to TSP.gov. The board also regularly offers training sessions for TSP participants who are looking to learn more about the retirement savings plan.
Weaver noted that the annual survey isn’t the only look that the board can get into TSP participants’ satisfaction. Accenture Federal Services, the new recordkeeping contractor for the TSP, also gathers feedback daily from participants who take certain actions in their accounts, such as loans and withdrawals. These more frequent surveys ask participants about their experience with one-off interactions with the TSP.
The answer to improving satisfaction is not to do a massive overhaul of the TSP, though. Instead, Weaver said the board will be focusing on small, manageable changes moving forward, such as a new loan tracking feature available in My Account.
“Those are the kinds of things that we’re trying to make improvements on,” Weaver said. “They’re not huge innovations, but they certainly respond to what’s driving participant dissatisfaction.”